Conditional Formatting in Excel (Step By Step Guide)
Conditional formatting is a powerful feature in Microsoft Excel that allows you to visually enhance your data by applying different formatting styles based on specified conditions.
Whether you're a beginner or an experienced user, understanding how to use conditional formatting can greatly enhance your data analysis and presentation skills.
In this article, we'll delve into the world of conditional formatting in Excel, exploring its uses, advantages, and providing you with step-by-step examples to make your data truly stand out.
Table of Contents:
1. What is Conditional Formatting in Excel?
Conditional formatting is a feature that allows you to automatically format cells based on certain rules or conditions.
By setting up these rules, you can visually highlight specific data points, trends, or anomalies in your Excel spreadsheets, making it easier for your audience to understand and analyze the data at a glance.
2. Applying Conditional Formatting Based on Cell Value
Conditional formatting based on cell values is one of the most common use cases.
You can apply various formatting styles, such as font color, background color, and cell borders, to cells that meet specific conditions.
For example, you might want to highlight all sales figures greater than a certain threshold in green and those below it in red.
To achieve this:
- 1. Select the range of cells you want to format.
- 2. Navigate to the "Home" tab and click on "Conditional Formatting."
- 3. Choose "New Rule," then select "Format cells that contain."
- 4. Define your conditions and formatting options, such as font color and fill color.
- Set the Conditions: In the "Format cells that contain" section, configure the conditions:
- In the "Format cells with" dropdown, choose "Cell Value."
- In the "Cell Value" field, select "greater than."
- In the "Value" field, enter 1500 (the threshold amount) or choose "C2" cell in this case.
- 5. Click "OK" to apply the conditional formatting.
- 6. Add Another Rule: After setting the rule for sales figures greater than $1500, click the "Add" button to add another rule or click manage rule for sales figures below or equal to $1500.


Now, the sales figures greater than $1500 will be highlighted in green, and those below or equal to $1500 will be highlighted in red.

3. Conditional Formatting Based on Date
Conditional formatting based on dates is particularly useful for tracking deadlines, milestones, or trends over time.
Assume you have a task tracking table like this:
You want to highlight tasks with due dates that are overdue in red within target date.
Here's how you can achieve this using Conditional Formatting:
- Select the Range: Select the cells containing the due dates that you want to format. In this example, select the range of cells under the "Due Date" column (excluding the header).
- Navigate to Conditional Formatting: Go to the "Home" tab on the Excel ribbon.
- Choose New Rule: Click on the "Conditional Formatting" button in the "Styles" group. From the dropdown menu, select "New Rule."
- Select a Rule Type: In the "New Formatting Rule" dialog box, choose "Use a formula to determine which cells to format" under the "Select a Rule Type" section.
- Set the Condition for Overdue Dates: In the "Format values where this formula is true" field, enter the following formula to highlight overdue dates in red:
- =AND(B2<>" " , B2<$D2$)

4. Leveraging Conditional Formatting in Google Sheets
Conditional formatting isn't limited to Excel, it's also a key feature in Google Sheets. The process is quite similar, allowing you to create visually appealing and informative spreadsheets.
5. Real-Life Examples of Conditional Formatting
Let's look at a couple of real-world examples:
Example 1: Progress Tracker
Suppose you're tracking project progress. You can use conditional formatting to color-code tasks based on their completion status.
For instance, cells with "Not Started" could be red, "In Progress" yellow, and "Completed" green.
Example 2: Heat Map
In a sales report, you can create a heat map by applying conditional formatting to show which products or regions are performing well.
Higher sales values could be represented with darker shades, while lower values are lighter.
Conclusion
Conditional formatting is a game-changer when it comes to data visualization and analysis in Excel.
It empowers you to convey insights effectively and make your spreadsheets more engaging.
Whether you're highlighting trends, tracking dates, or creating interactive dashboards, mastering conditional formatting will undoubtedly elevate your Excel skills.
Incorporate these techniques into your Excel repertoire, and you'll be well on your way to creating professional, visually compelling spreadsheets that truly make an impact.
Remember, when it comes to optimizing your website for the best results, ExcelNeeds.com is here to provide expert advice, tutorials, and resources for all your Excel-related needs.
Download
Related Blogs

How Excel Can Improve Your Productivity at Work
In today’s fast-paced business world, productivity is more important than ever. We are all looking for ways to streamline our work and get more done in less time. One tool that can help us achieve this is Microsoft Excel.
Read More ..
Most Used Formulas in Excel with Examples
Microsoft Excel is a widely used spreadsheet software that enables users to organize, manipulate, and analyze data with ease.
Read More ..
INDEX MATCH Function with Examples
In the realm of Excel, the INDEX MATCH function stands as a powerful tool that unlocks the potential to manipulate and extract data efficiently.
Read More ..
How to Create a Dashboards in Excel?
In today's data-driven world, Excel dashboards have become indispensable tools for professionals across various industries.
Read More ..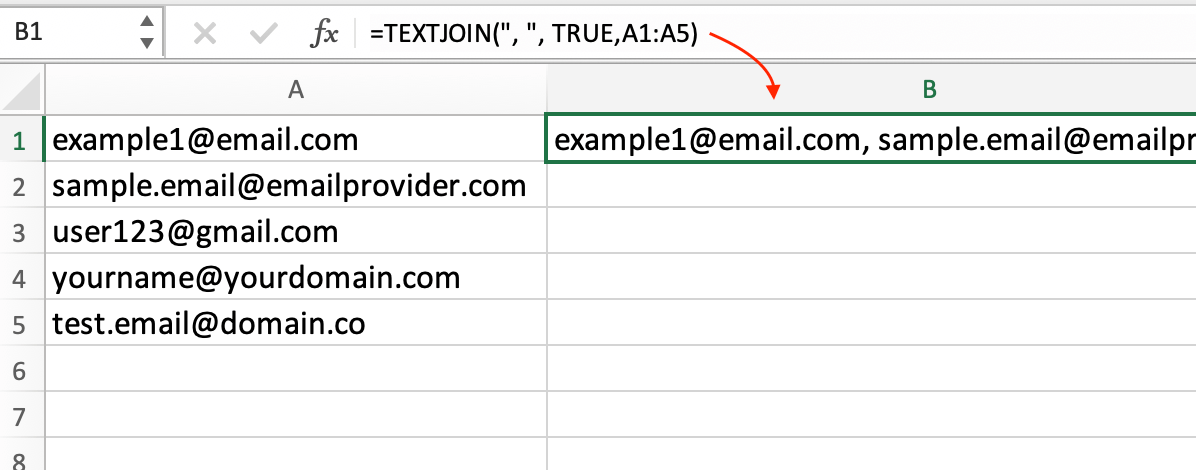
How to Combine Cells in Excel?
Excel is a powerful tool that can handle a multitude of tasks, from complex calculations to data analysis. One essential skill for Excel users is knowing how to combine cells efficiently.
Read More ..