How to Create a Dashboards in Excel?
In today's data-driven world, Excel dashboards have become indispensable tools for professionals across various industries.
They provide a dynamic and visually appealing way to analyze and present data, making complex information easily digestible.
In this article, we will delve into the world of Excel dashboards, covering everything from the basics to advanced techniques.
By the end of this tutorial, you'll have the knowledge and skills to create stunning Excel dashboards that will impress your colleagues and superiors.
Table of Contents:
- 1. What is an Excel Dashboard and how does it differ from a report?
- 2. How to Create an Excel Dashboard?
- 3. Things to Do Before You Even Start Creating an Excel Dashboard
- 4. Getting the Data in Excel
- 5. Outlining the Structure of the Dashboard
- 6. Excel Table – The Secret Sauce of an Efficient Excel Dashboard
- 7. Important Excel Functions for Dashboards
- 8. Interactive Tools to Make Your Excel Dashboard Awesome
- 9. Using Excel Charts to Visualize Data in an Excel Dashboard
- 10. Excel Dashboards Do’s and Don’ts
- 11. Dashboard Examples
- 12. Conclusion
1. What is an Excel Dashboard and how does it differ from a report?
In this section, we will walk you through the step-by-step process of creating an Excel dashboard, from setting up your Excel sheet to designing a user-friendly interface.
Creating an Excel dashboard involves several key steps:
Excel dashboards are dynamic data visualization tools that allow you to present information in a visually compelling way.
They go beyond static reports by offering interactivity and real-time data updates. In essence, dashboards provide a holistic view of your data, enabling users to make informed decisions quickly.
2. How to Create an Excel Dashboard?
In this section, we will walk you through the step-by-step process of creating an Excel dashboard, from setting up your Excel sheet to designing a user-friendly interface.
Creating an Excel dashboard involves several key steps:
- Define your objectives: Clearly outline the goals of your dashboard and identify the key metrics you want to visualize.
- Gather your data: Collect and organize the data you need for your dashboard. This may involve importing data from external sources or using existing Excel files.
- Design your layout: Plan the structure and layout of your dashboard. Decide where to place charts, tables, and interactive elements for optimal user experience.
- Create visualizations: Use Excel's charting tools to create visually appealing graphs and charts that represent your data effectively.
- Add interactivity: Enhance your dashboard's usability by adding interactive elements such as slicers, drop-down lists, and buttons.
- Test and refine: Test your dashboard with potential users and gather feedback to make necessary improvements.
3. Things to Do Before You Even Start Creating an Excel Dashboard
Preparation is key to a successful Excel dashboard project. We'll discuss essential steps to take before you start building, ensuring a smoother workflow and better results.
- Define your audience: Understand who will be using the dashboard and what information is most relevant to them.
- Set clear goals: Establish specific objectives for your dashboard. What insights do you want to provide? What actions should users be able to take?
- Gather and clean data: Ensure that your data is complete, accurate, and well-structured. Cleaning and organizing your data in advance will save you time later.
- Choose the right data sources: Consider where your data will come from. It may involve extracting data from databases, APIs, or other software.
- Select appropriate Excel tools: Familiarize yourself with the Excel features and functions that will be most useful for your dashboard project.
4. Getting the Data in Excel
Data is the lifeblood of any dashboard. Learn various methods to import and manage your data efficiently within Excel
- Importing external data: Excel offers various methods to import data from external sources, including CSV files, databases, and web services.
- Data cleansing and transformation: Use Excel's data cleaning and transformation tools to ensure your data is accurate and ready for analysis.
- Data connections: Set up data connections to keep your dashboard updated automatically with fresh data.
- Data modeling: Create relationships between data tables in Excel's Power Pivot for more advanced analysis.
5. Outlining the Structure of the Dashboard
A well-structured dashboard is crucial for effective data communication. We'll guide you on how to plan and organize your dashboard elements.
- Storyboarding: Create a rough sketch or storyboard of your dashboard layout, indicating where each element will be placed.
- Hierarchy: Establish a hierarchy of information, with the most important data prominently displayed.
- Navigation: Plan how users will navigate through your dashboard, especially if it contains multiple pages or sections.
- Consistency: Maintain a consistent design throughout the dashboard to ensure a cohesive user experience.
6. Excel Table – The Secret Sauce of an Efficient Excel Dashboard
Excel tables provide a powerful and flexible way to manage your data. Discover how to harness their potential to enhance your dashboard's functionality.
- Advantages of Excel tables: Learn why Excel tables are a crucial component of efficient dashboards, including automatic data expansion and dynamic range names.
- Creating Excel tables: Step-by-step instructions on how to create and format tables in Excel.
- Table features: Explore advanced features such as calculated columns, sorting, filtering, and total rows.
7. Excel Functions for Dashboards
Excel offers a wide array of functions that can be used to manipulate and analyze data. We'll highlight key functions that are indispensable for dashboard creation.
- SUMIFS and COUNTIFS: Aggregate data based on specific criteria to calculate sums and counts for your dashboard metrics.
- VLOOKUP and HLOOKUP: Retrieve data from other parts of your workbook or external sources to populate your dashboard.
- IF and nested IF statements: Create conditional logic to display different data or messages based on user interactions
- INDEX and MATCH: Combine these functions to perform powerful lookups in your data.
8. Interactive Tools to Make Your Excel Dashboard Awesome
Interactivity is one of the hallmarks of a great dashboard. Explore tools and techniques to add user-friendly interactivity to your Excel dashboard.
- Slicers: Create slicers to allow users to filter data dynamically.
- Form controls: Add buttons, check boxes, and drop-down lists to enable user interactions.
- Hyperlinks: Link relevant parts of your dashboard to external resources or additional information.
- Dynamic charts: Use Excel's features to create charts that update in real-time based on user selections.
9. Using Excel Charts to Visualize Data in an Excel Dashboard
Charts in Excel are the visual elements that bring your data to life. We'll cover various chart types and how to use them effectively in your dashboard.
- Bar charts and column charts: Ideal for comparing data across categories or time periods.
- Line charts: Visualize trends and changes over time.
- Pie charts: Display proportions and percentages within a whole.
- Scatter plots: Show relationships between two sets of data points.
10. Excel Dashboards Do’s and Don’ts
Learn the best practices and common mistakes to avoid when designing and using Excel dashboards.
- Do's: Include clear and concise labels, use color strategically, and focus on user needs.
- Don'ts: Avoid clutter, excessive data, and confusing visualizations.
11. Dashboard Examples
Gain inspiration from real-world examples of Excel dashboards, including an Excel KPI Dashboard, Expense Tracker Dashboard, and Estimated Vs actual time visualized in an Excel Dashboard.
- Excel KPI Dashboard: Explore a KPI dashboard that tracks key performance indicators for a sales team, including revenue, conversion rates, and customer satisfaction.
- Expense Tracker Dashboard: See how a people uses a dashboard to monitor Expenses by category, by date with graphical representation.
- Estimated Vs Actual Time Tracker: Witness the power of Excel in visualizing the performance of Estimated Vs Actual time tracker.

![]()
![]()
Conclusion
Excel dashboards are powerful tools for turning data into actionable insights. Whether you're a business analyst, project manager, or data enthusiast, mastering the art of Excel dashboards can significantly boost your productivity and effectiveness.
By following the steps outlined in this comprehensive tutorial, you'll be well on your way to creating impressive Excel dashboards that make an impact.
Start your journey to becoming a dashboard guru today!

Related Blogs

How Excel Can Improve Your Productivity at Work
In today’s fast-paced business world, productivity is more important than ever. We are all looking for ways to streamline our work and get more done in less time. One tool that can help us achieve this is Microsoft Excel.
Read More ..
Most Used Formulas in Excel with Examples
Microsoft Excel is a widely used spreadsheet software that enables users to organize, manipulate, and analyze data with ease.
Read More ..
INDEX MATCH Function with Examples
In the realm of Excel, the INDEX MATCH function stands as a powerful tool that unlocks the potential to manipulate and extract data efficiently.
Read More ..
How to Create a Dashboards in Excel?
In today's data-driven world, Excel dashboards have become indispensable tools for professionals across various industries.
Read More ..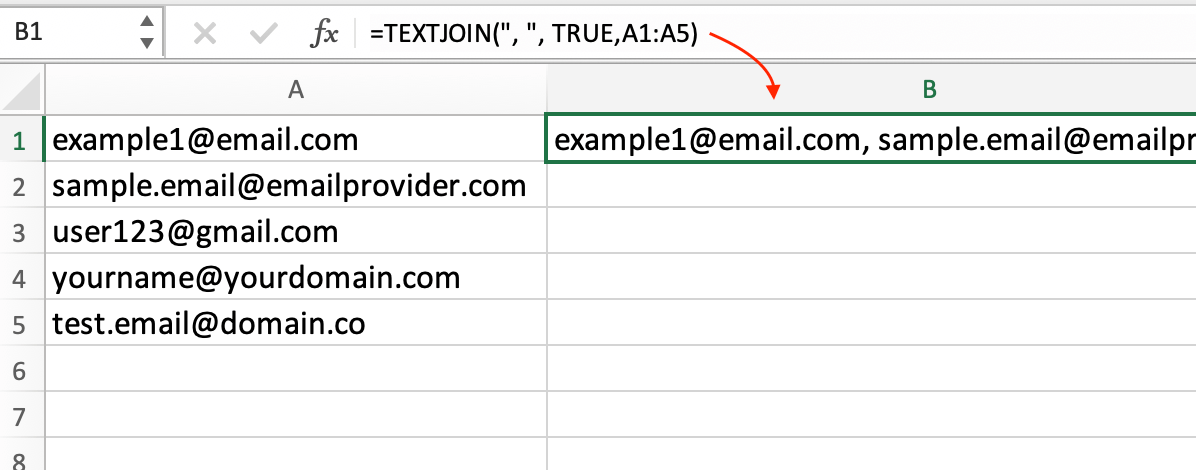
How to Combine Cells in Excel?
Excel is a powerful tool that can handle a multitude of tasks, from complex calculations to data analysis. One essential skill for Excel users is knowing how to combine cells efficiently.
Read More ..